The following table lists the various windows/tools within SimVision MS that provide access to the analog and digital components of a mixed-signal design.
| Window/Tool | Icon | Description |
|---|---|---|
| Design Browser |
|
Shows the true design hierarchy tree with different icons and colors for mixed and electrical instances. |
| Schematic Tracer |
|
Generates the Verilog-AMS/Spectre/SPICE context electrical schematic displaying the critical path. |
| Browse Currents Sidebar |
|
Allows interactive current probing in analog context (Verilog-AMS/Spectre/SPICE) without requiring to probe the static current. |
| Mixed Net Browser |
|
Displays detailed identification of the connect module instances. The connect module instances table is similar to profiling, it lets you sort and compare all the connect modules in the design. |
| Source Browser |
|
Shows the source code of connect module instances and also displays the Spectre and SPICE nestlists. |
| Waveform Window |
|
Plots simulation data along the X=time and Y axis. Data is usually shown as signal values versus time, but it can be any recorded data. It also has the capability to send a vector that is already plotted in SimVision to ViVA. |
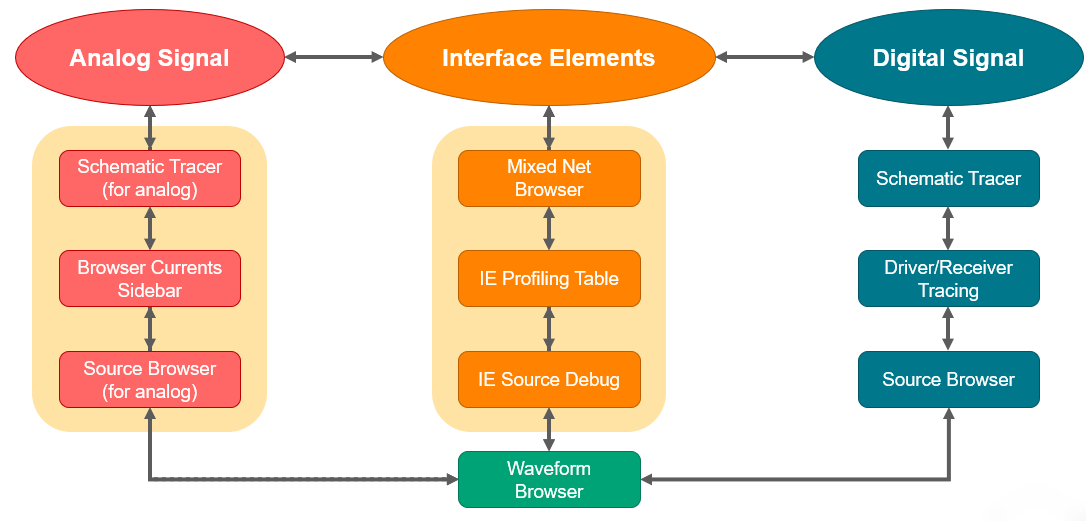
The following illustration displays how these tools interact with each other to give you a seamless debugging experience.