Product Documentation
Virtuoso Visualization and Analysis XL SKILL Reference
Product Version IC23.1, November 2023

triggeredDelay

triggeredDelay(
o_signal1
o_signal2
n_threshold1
s_edgeType1
n_threshold2
s_edgeType2
[ ?multiple g_multiple]
[ ?nth x_nth ]
[ ?periodicity x_periodicity ]
[ ?tol1 n_tolerance1 ]
[ ?tol2 n_tolerance2 ]
[ ?xName s_xName ]
)
=> o_waveform / n_value / nil

Description

Calculates the delay from the trigger point on the edge (either rising or falling) of a triggering signal to the next edge (either rising or falling) of the target signal.

Arguments

o_signal1

Triggering signal.

o_signal2

Target signal.

n_threshold1

Threshold value of the triggering signal.

s_edgeType1

Direction of the crossing event for the triggering signal.

  • rising: Directs the function to look for crossings events where the y values are increasing.
  • falling: Directs the function to look for crossings events where the y values are decreasing.
  • either: Directs the function to look for crossings events in either direction.

n_threshold2

Threshold value of the target signal.

s_edgeType2

Direction of the crossing event for the target signal.

  • rising: Directs the function to look for crossings events where the y values are increasing.
  • falling: Directs the function to look for crossings events where the y values are decreasing.
  • either: Directs the function to look for crossings events in either direction.

?multiple g_multiple

Specifies whether to retrieve only one occurrence of a delay event for the waveform (single), or all occurrences of an overshoot for the waveform.

Valid values are:

  • t: Returns the waveform of measured delay starting from the nth edge.
  • nil: Returns a single delay at the nth edge.

Default value is t.

?nth x_nth

Edge number of the triggering signal from which delay is to be calculated.

Default value is 1, which indicates that delay is calculated from the first edge of the triggering signal.

?periodicity x_periodicity

Periodic interval for the triggering signal.

Default value is 1.

?tol1 n_tolerance1

Tolerance value to detect the threshold crossings for the triggering signal.

Default value is 0.0.

?tol2 n_tolerance2

Tolerance value to detect the threshold crossings for the target signal.

Default value is 0.0.

?xName s_xName

Specifies whether to retrieve delay data against trigger time, target time (or another x-axis parameter for non-transient data), or cycle.

Possible values are trigger, target, and cycle.

Default value is trigger.

Value Returned

o_waveform

Waveform if the ?multiple argument is set to t.

n_value

nil

because of an error.

Examples

The following example opens simulation results stored in the specified directory.

openResults("/servers/user/triggeredDelay.psf")
=> "/servers/user/triggeredDelay.psf"

The following example lists the results stored in the directory.

results()
=> ("tran")

The following example selects the tran results stored in the specified results directory triggeredDelay.psf.

selectResults('tran)
=> stdobj@0x2d4000c8

The tran results of the results directory triggeredDelay.psf contain two signals, samphold and v2net.

The following examples plot signals samphold and v2net in separate subwindows.

awvPlotSignals('(("/servers/user/triggeredDelay.psf" (("tran" ("samphold"))))) ?plotStyle "New Subwindow")
=> t
awvPlotSignals('(("/servers/user/triggeredDelay.psf" (("tran" ("v2net"))))) ?plotStyle "New Subwindow")
=> t

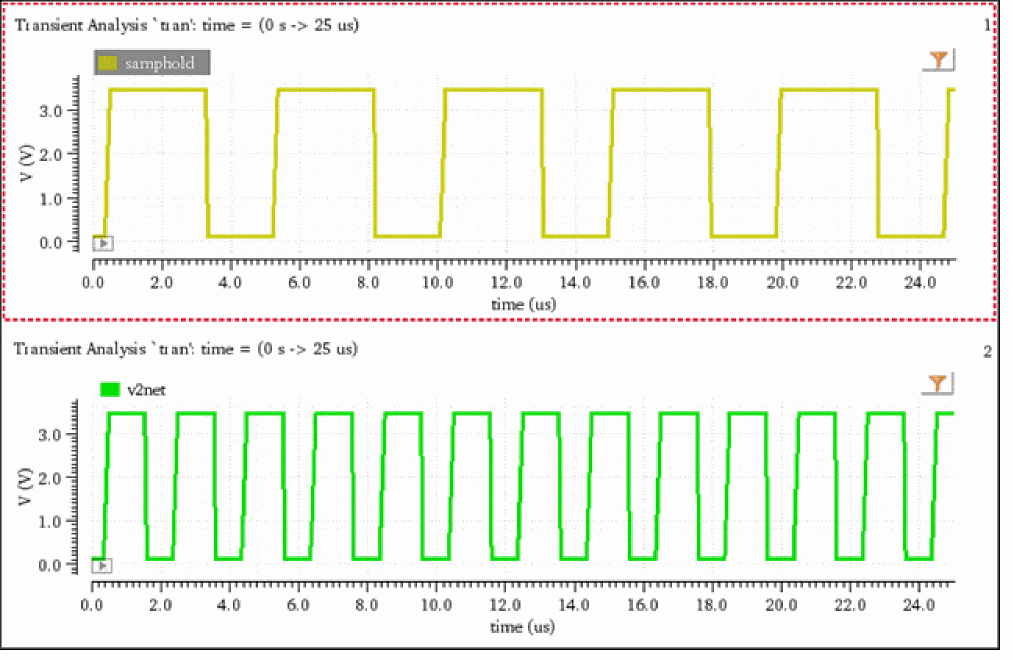
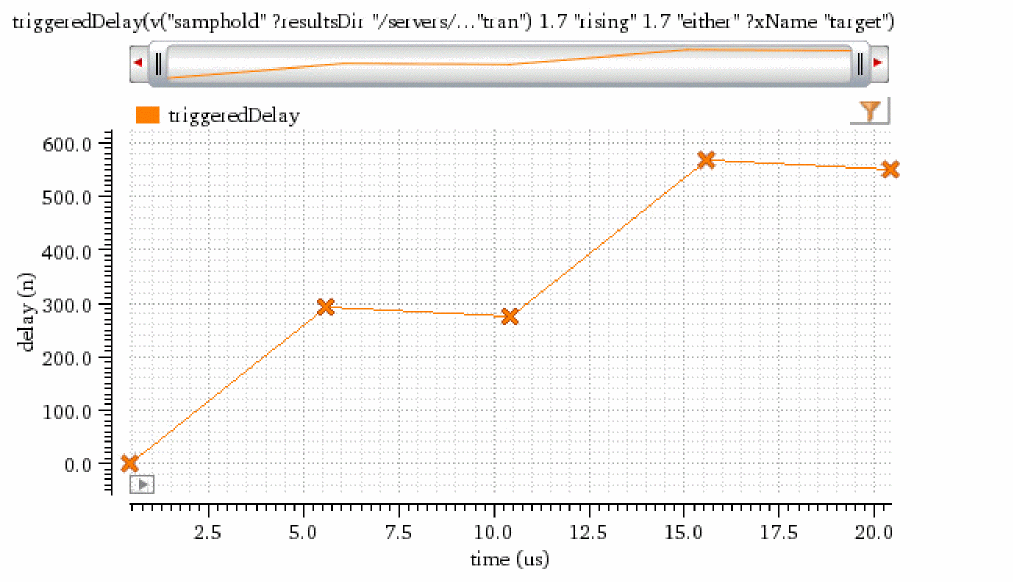
The following example calculates delay from the trigger point on the first rising edge of the triggering signal, samphold, to the next edge (either rising or falling) of the target signal, v2net.

delay=triggeredDelay(v("samphold" ?result "tran") v("v2net" ?result "tran") 1.7 "rising" 1.7 "either" ?multiple t ?xName "target")
=> srrWave:0x2fbe4070

The following example creates a new Waveform window.

awvCreatePlotWindow()
=> window:5

The following example plots the waveform represented by delay in the newly created Waveform window.

awvAppendWaveform(awvGetCurrentWindow() list(delay) ?expr list("triggeredDelay") ?color list("y6") ?index list(2) ?lineType list("line") ?showSymbols list(t) ?dataSymbol list("x"))
=> t


Return to top
 ⠀
X