The Design Browser window presents a graphical display of your design and provides access to the other SimVision MS windows.
The Design Browser window lets you access the objects in your design. You can use it to locate the signals and variables that you want to debug. You can also select objects in Design Browser and send to the Schematic Tracer or the Waveform window for further analysis.
Design Browser in SimVision MS is as shown in the following figure.
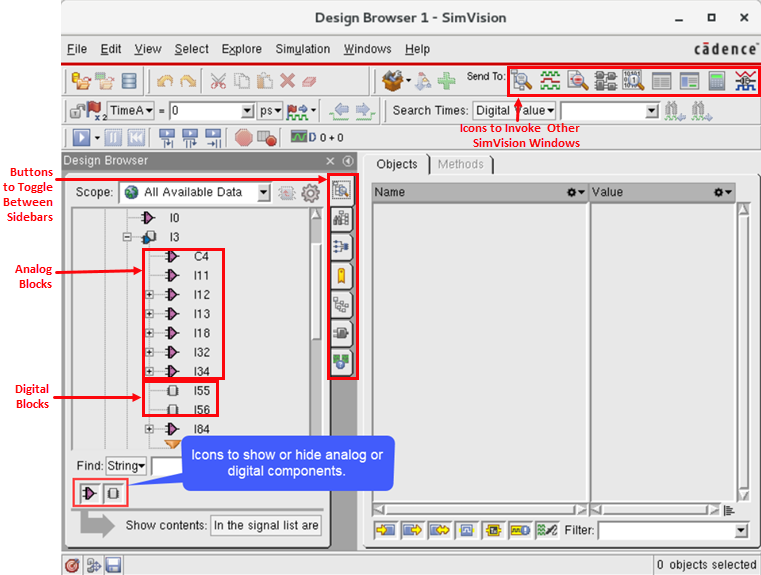
Design Browser contains two primary panes. On the left is the Scope Tree pane, which displays your current design hierarchy in a graphical tree representation. On the right is the Signal List pane, which displays a list of signals with their current simulation values.
Related Topics
- Viewing the Mixed-Signal Design Hierarchy
- Using the Menus and Forms for AMS Designs
- Setting Display and Formatting Preferences for Verilog-AMS Objects
- Selecting Objects
- Searching Instances
- Searching Modules or Subcircuits
- Disabling Grouping of Library Cells
- Sending Instances to Other Windows