Product Documentation
Virtuoso Visualization and Analysis XL SKILL Reference
Product Version IC23.1, November 2023

awvAppendList

awvAppendList(
w_windowID
l_yListList
l_xList
[ ?expr l_exprList ]
[ ?index l_waveIndexList ]
[ ?color l_colorList ]
[ ?lineType l_lineTypeList ]
[ ?lineStyle l_lineStyleList ]
[ ?lineThickness l_lineThicknessList ]
[ ?showSymbols l_showList ]
[ ?dataSymbol l_symbolList ]
[ ?barBase t_barBase ]
[ ?barWidth t_barWidth ]
[ ?barShift t_barShift ]
[ ?subwindow x_subwindow ]
)
=> t / nil

Description

Plots y values in l_yListList against x values in l_xListList and adds the resulting waveforms to a subwindow.

The new waveforms are plotted in the same strip and y axis as their corresponding curve in l_waveIndexList. Also, the new waveforms are assigned the next lowest unassigned numbers. If l_waveIndexList contains curves 1 and 2, the curves resulting from plotting x and y values are numbered 3, 4, and so on.

If you do not specify l_waveIndexList, the new waveforms are plotted at the Y axis and strip of existing waveforms with the lowest numbers. These new waveforms are assigned the lowest unused numbers.

Arguments

w_windowID

Waveform window ID.

l_yListList

A list of lists that specifies y-axis values. Each list must have the same number of items.

l_xList

A list that specifies x-axis values. Number of items in this list must be equal to the number of items in each list specified by l_yListList.

?expr l_exprList

List of waveform names to be displayed in the trace legend.

?index l_waveIndexList

List of integers identifying existing waveform curves that were plotted with one of the Waveform window plot functions.

If you do not specify index numbers for the waveforms in l_waveIndexList, the lowest unused numbers in the subwindow are assigned.

?color l_colorList

List of colors for the waveforms. Available colors are defined in your technology file. Valid values are from y1 through y66.

If you do not specify this argument, default colors are used.

?lineType l_lineTypeList

List specifying the type of line to be used for the waveforms.

Valid values are line, bar, scatterPlot, poleZero.

If you do not specify this argument, default value line is used.

?lineStyle l_lineStyleList

List specifying the line style to used for the waveforms.

Valid values are solid, dash, dot, dashDot, and dashDotDot.

If you do not specify this argument, default value solid is used.

?lineThickness l_lineThicknessList

List specifying the line thickness of the waveforms.

Valid values are fine, medium, thick, and extraThick.

If you do not specify this argument, default value fine is used.

?showSymbols l_showList

List of flags that specify whether to show the symbols on the waveforms. Valid values are t and nil.

The default value is nil, which means that symbols are not displayed on the waveforms.

The number of flags in the l_showList must match the number of symbols in the l_symbolList.

?dataSymbol l_symbolList

List of symbols to be displayed for data points on the waveforms.

To use a symbol, specify an integer or a single character corresponding to the symbol.

?barBase t_barBase

Base of the bar.

?barWidth t_barWidth

Width of the bar.

This argument takes integer values. The default value is 1.

?barShift t_barShift

Specifies whether to shift the bar ahead or backwards when the ?lineType argument is set to bar. This argument takes integer values.

Positive integer shifts the bar backwards and negative integer shifts the bar forward.

The default value is 0, which indicates that bar is not shifted.

?subwindow x_subwindow

Identification number of the subwindow, which is found in the top-right corner of the subwindow.

If you do not specify this argument, the current subwindow is used.

?yNumber l_yNumberList

List of integers identifying the y axis. Valid values are from 1 through 4.

?stripNumber l_stripNumberList

List of integers identifying the strips.

Value Returned

t

Specified y-axis values are plotted against the specified x-axis values and the corresponding waveforms are displayed in the specified window.

nil

Waveforms cannot be plotted because of an error.

Examples

The following example creates a Waveform window and returns its window ID.

awvCreatePlotWindow()
=> window:3

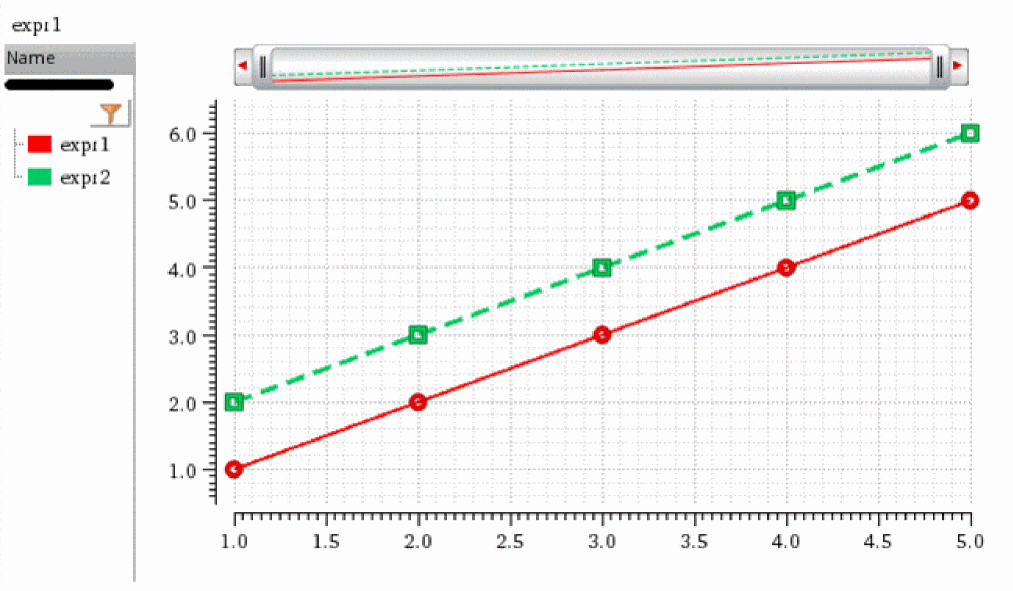
The following example plots y-axis values (1, 2, 3, 4, 5) and (2, 3, 4, 5, 6) against x-axis values (1, 2, 3, 4, 5) as waveforms with names expr1 and expr2. The waveforms expr1 and expr2 are assigned with the index numbers 3 and 4, respectively.

awvPlotList(window(3) list(list(1 2 3 4 5) list(2 3 4 5 6)) list(1 2 3 4 5) ?expr list("expr1" "expr2") ?index list(3 4) ?color list("y1" "y66") ?lineType list("line" "line") ?lineStyle list("solid" "dash") ?lineThickness list("medium" "thick") ?showSymbols list(t t) ?dataSymbol list(4 5))
=> t

Note that expr1 uses a symbol corresponding to integer 4, which is a circle. expr2 uses a symbol corresponding to integer 5, which is a square.

The following function returns the index numbers and names of the waveforms plotted in the window 3.

awvGetWaveNameList(window(3))
=>
((3 4) 
    ("expr1" "expr2")
)

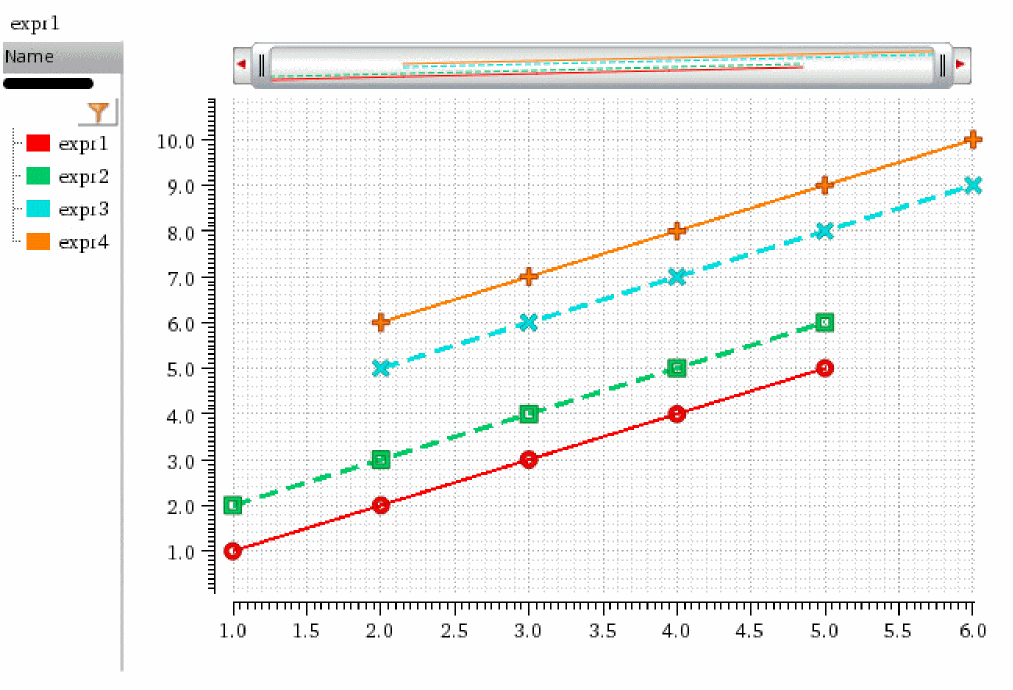
The following example plots y-axis values (5, 6, 7, 8, 9) and (6, 7, 8, 9, 10) against x-axis values (2, 3, 4, 5, 6) as waveforms with names expr3 and expr4 and appends them in the Waveform window with ID 3.

awvAppendList(window(3) list(list(5 6 7 8 9) list(6 7 8 9 10)) list(2 3 4 5 6) ?expr list("expr3" "expr4") ?color list("y12" "y6") ?lineType list("line" "line") ?lineStyle list("dash" "solid") ?lineThickness list("thick" "medium") ?showSymbols list(t t) ?dataSymbol list("x" "+"))
=> t

Note that expr3 uses a symbol corresponding to character "x", which is a cross sign. expr4 uses a symbol corresponding to character "+", which is a plus sign.

The following example returns the index numbers and names of waveforms plotted in the Waveform window with ID 3.

awvGetWaveNameList(window(3))
=>
((3 4 5 6) 
    ("expr1" "expr2" "expr3" "expr4")
)

Related Topics

Symbols for Data Points


Return to top
 ⠀
X