Annotation Browser Pane
The Browser Pane displays the markers corresponding to each application category supported by a tab. For example, in the Constraints tab, the browser pane displays markers for all the supported categories: Specialty Routing, Placement, and Design and Process Rules.
When you select a marker in the browser pane, it is automatically highlighted in the canvas and vice versa. The current marker is colored magenta in the browser and is haloed in the canvas. If you selected a marker in the canvas and that marker is listed in a tab that is currently hidden, that tab is automatically brought to the front and the tree is scrolled to show the selected marker. Where there are multiple selected markers on different tabs, the focus is given to the current (magenta) marker of the selected set.
The columns in the table show the following information for each marker.
Depending on the tab you are using to view the markers, one or more of the columns listed below may not be available. For example, the Tool column is not available in the Connectivity and IDF tabs. Likewise, the Signal Type column is supported by the Connectivity tab, but not supported by the other tabs.
|
Icon
|
Name
|
Description
|
|
|
Tree
|
Shows the various categories of markers generated by an application. The marker categories are displayed in a Tree structure. The top category node indicates the marker type and the nodes below list marker sub-categories, if any, or the impacted instances or nets, and their location.
Every category in the tree is followed by two numbers in parentheses. The first of these is the number of categories one level below the current node; the second is the total number of markers under the current node.
|
|

|
Set Highlight State
|
Shows and sets the highlight state of the corresponding marker in the design window. Clicking in this column for a particular node sets the highlight state for all the markers under that node.
A grayed-out version of the icon displayed against a node indicates that only some of the markers under that node are highlighted.
To set or unset the highlight state for all the markers, click the column header.
|
|

|
Set Highlight Color
|
Shows and sets the color used to draw the corresponding marker in the design window.
Clicking in this column for a node sets the highlight color for all the markers under that node.
To set the same color for all the markers, click the column header and choose a color from the color menu.
Choose cycle to let Layout XL select the colors automatically by cycling through a predefined list.
If the node has the dot ( ) icon in this column, it implies that no single color is assigned for the markers in the node. The markers either have no color assigned or at least one marker has a different color from the rest.
If the node has a color in this column, it implies that all the markers in the node have the same highlight color assigned.
This command does not change the color assigned to the marker in the database, it only changes the color used to draw the marker in the canvas.
|
|

|
Set Marker Check State
|
Shows and sets the Checked state of the corresponding marker. When a marker is set to Checked, you can use the Hide Checked Markers button to hide it in the Annotation Browser.
Clicking in this column for a particular node sets the Checked state for all the markers under that node.
To set the Checked state for all the markers, click the column header.
-
If the node displays a tick (
 ) in the check box, it implies that all the markers in the node have the Checked state set.
 -
If the node displays a dot (
 ) in the check box, it implies that at least one marker under the node is unchecked.
 -
If the node displays an empty check box (
 ), it implies that the Checked state is not applied.
This command has no effect on the marker display in the canvas, it only controls the marker display in the Annotation Browser.
|
|
|
Description
|
Shows a message describing the marker in more detail. Similar information is presented in the Description pane at the bottom of the assistant.
This column is hidden by default.
|
|
|
Lib Name
|
Shows the master library of the cell associated with the marker.
This column is hidden by default.
|
|
|
Cell Name
|
Shows the master cell name of the cell associated with the marker.
This column is hidden by default.
|
|
|
View Name
|
Shows the master view name of the cell associated with the marker.
This column is hidden by default.
|
|
|
Layers
|
Shows the name of the layer associated with the marker.
This column is hidden by default in the layout window Annotation Browser. It is not available in the schematic window Annotation Browser.
|
|
|
Purposes
|
Shows the purpose of the layer associated with the marker.
This column is hidden by default in the layout window Annotation Browser. It is not available in the schematic window Annotation Browser.
|
|
|
Nets
|
Shows the net associated with the marker.
This column is hidden by default.
|
|
|
Tools
|
Shows the Virtuoso tool, such as VLS Constraint Aware Editing, that generated the marker.
This column is hidden by default.
|
|
|
Signal Type
|
Shows the signal type of the nets associated with the marker.
|
|
|
Severity
|
Shows the criticality of the marker.
This column is hidden by default.
|
|
|
Short Message
|
Shows a brief message that gives a quick overview to the marker.
The message provided in this column is much shorter compared to the one displayed in the Description pane.
The Short Message column is hidden by default.
|
|
|
Bbox
|
Shows the coordinates of the marker bounding box.
This column is hidden by default.
|
|
|
Depth
|
Shows the lowest depth at which the cellview that contains the marker was found.
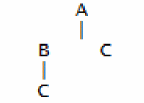
Let us consider the simple hierarchy represented by the image below:
-
If the Annotation Browser scope is set to Top Cellview To Depth with a depth of
3, then the markers associated with C will display 2 in the Depth column. -
If the Annotation Browser scope is set to Top Cellview To Depth with a depth of
1, then the markers associated with C will display 1 in the Depth column.
|
|
|
Type
|
Shows the marker type.
This column is hidden by default.
|
|
|
State
|
Shows the current state of a marker.
The various states supported are: Fixed, Signoff, Waiver, or a blank State column.
|
|
|
Expected Value
|
Shows the expected value of the marker.
|
|
|
Same Mask
|
Shows the same mask spacing violation markers, which indicate that the distance between two shapes locked to the same color is less than the required same mask spacing as defined in the technology file.
|
|
|
Rule
|
Shows the rule ID of a design rule from which the “rule” constraint originates. The rule ID is derived from the Virtuoso Layout Migrate technology database.
If the constraint is not originating from a “rule”, the Rule column displays a string to indicate the origin of the constraint. For example, connectivity.
The Rule column is only supported by the IDF tab.
|
|
|
Dist
|
Shows the current distance of the constraint with an optional bracket to show the original distance if the constraint was relaxed, (for example,. “.13 [.26]”).
The Dist column is only supported by the IDF tab.
|
|
|
Cost
|
Shows the current cost of the constraint.
The Cost column is only supported by the IDF tab.
|
Related Topics
Annotation Browser Assistant
Annotation Browser Tabs
Annotation Browser Shortcut Menus
Annotation Browser Options Form
Markers Generated by Connectivity Extractor
Layout XL Assistants
Return to top